If you’ve been paying attention to financial headlines or grocery store receipts lately, you’ve probably heard the word “inflation” come up more often than you’d like. But what does it actually mean for you as an investor?
Inflation may not be something you can avoid, but understanding how it works may help you make more informed decisions about your financial strategy. In this guide, you’ll find clear explanations of what inflation is, how it’s measured, what causes it, and how it may impact your investments over time.
The inflation rate measures how fast prices rise, usually year over year.
It’s expressed as a percentage and may help track the pace of inflation.
Commonly measured by CPI (Consumer Price Index) and PCE (Personal Consumption Expenditures).
A rising inflation rate may erode real returns on investments.
What is inflation?
At its core, inflation is the rate at which the general level of prices for goods and services rises, causing the purchasing power of money to fall. In other words, as inflation increases, each dollar you have buys a little less.
Unlike day-to-day expenses like groceries or gas, as an investor, you experience inflation more directly through changes in the value of investment returns, interest rates, and the cost of capital. Inflation doesn’t just impact your cost of living—it also plays a role in how markets behave and how asset values evolve over time.
Let’s say a cup of coffee costs $3.50. For $10.00, you’ll be able to purchase two cups of coffee. However, if you choose to save your money, and prices increase for a single cup by $2.00 (to $5.50), you would now only be able to purchase one cup of coffee if you only had $10.00. The rate of inflation heavily impacts consumers’ purchasing power and the cost of living, which affects the overall progression of an economy.
What causes inflation?
Inflation doesn’t come from one single source—it can be driven by a variety of factors. Here are some of the most common:
1. Demand-Pull inflation
This happens when consumer demand for goods and services outpaces supply. Think of it as too much money chasing too few goods. When demand exceeds what businesses can supply, prices tend to rise.
Example: During the COVID-19 pandemic, governments issued stimulus checks to boost consumer spending. This led to increased demand for goods like hand sanitizers and masks, which were in short supply. As a result, prices for these items rose significantly due to demand-pull inflation
2. Cost-Push inflation
This arises from increases in production costs, such as higher raw material prices or labor costs. When production costs rise, businesses may reduce supply and increase prices to maintain profitability.
Example: In 1973, OPEC restricted oil production, causing oil prices to skyrocket. This led to higher production costs for industries reliant on oil, such as transportation and manufacturing. As a result, these industries raised their prices, creating cost-push inflation
3. Built-In inflation
Built-in inflation, also known as wage-price inflation, occurs when people expect inflation to continue in the future. Workers may demand higher wages to keep up with expected price increases, leading businesses to raise prices further to cover these increased labor costs.
Example: In a strong economy with low unemployment, workers might demand wage increases to keep pace with rising living costs. If these wage increases are granted, businesses may raise prices to maintain profitability, creating a cycle of inflation.
Which indices are used to track inflation?
In the U.S., inflation is most commonly tracked using two primary indexes:
1. Consumer price index (CPI)
The CPI, published by the Bureau of Labor Statistics (BLS), measures the average change over time in the prices paid by urban consumers for a “basket” of goods and services. This basket includes items like food, housing, medical care, and transportation.
The core CPI excludes food and energy prices, which can be highly volatile, offering a more stable view of inflation trends.
2. Personal consumption expenditure (PCE) price index
The PCE is another widely used measure, particularly by the Federal Reserve. It covers a broader range of goods and services than CPI and adjusts for changes in consumer behavior—like substituting cheaper products for more expensive ones.
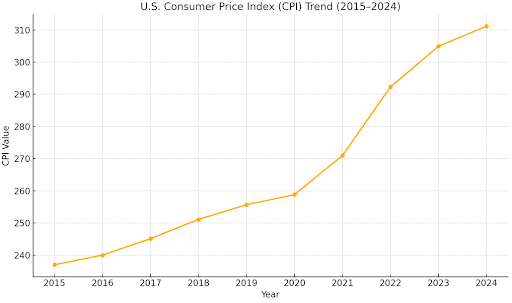
Over the last century, inflation in the U.S. has fluctuated significantly:
A visual chart showing the U.S. Consumer Price Index (CPI) trend from 2015 to 2024.
1970s and early 1980s: Double-digit inflation rates, partly due to oil shocks and monetary policy.
1990s to 2010s: A period of relative stability, with inflation averaging close to the Fed’s 2% target.
2021–2022: Inflation surged, peaking at over 9% (CPI) in June 2022—the highest since 1981—due to supply chain disruptions, energy price spikes, and post-pandemic demand.
2023–2024: Inflation gradually cooled but remained a key focus of Federal Reserve policy.
By March 2025, inflation has moderated, but it continues to influence interest rates, consumer spending, and financial markets.
What is the inflation rate?
The inflation rate is the percentage change in the average price level of goods and services in an economy over a period of time—usually a year. It tells you how much prices have increased (or decreased) and serves as a key indicator of economic health.
Example: Inflation rate in action for investors
Imagine you invested $10,000 in a five-year bond with a fixed annual interest rate of 4%. Over the five years, you receive $400 each year in interest, totaling $2,000. However, if the inflation rate averages 3% annually, the purchasing power of your principal and interest will decrease.
Real Return (Adjusted for Inflation): Assuming a 3% annual inflation rate, the purchasing power of your $12,000 after five years would be equivalent to about $9,800 in today’s dollars.
This means that despite earning a nominal return of 20%, your real return is negative when adjusted for inflation.
How is the inflation rate calculated?
In the U.S., the inflation rate is most often calculated using the Consumer Price Index (CPI) published by the Bureau of Labor Statistics (BLS).
Here’s a simplified breakdown of how it works:
CPI data collection: Each month, the BLS collects prices for a “basket” of goods and services that reflect typical consumer spending—items like groceries, rent, clothing, transportation, and healthcare.
Index creation: These prices are averaged and turned into an index number. The CPI index is set to 100 during a designated base period (e.g., 1982–1984). All future readings compare back to that baseline.
Inflation rate formula: Inflation Rate = (CPI This Year − CPI Last Year / CPI Last Year) × 100
Example:
If the CPI was 296.8 in February 2024 and 288.0 in February 2023, the inflation rate would be:
(296.8 − 288.0 / 288.0) × 100 = 3.06%
That means, on average, prices increased about 3.06% over that 12-month period.
How inflation may affect your investments
As an investor, inflation can influence your portfolio in multiple ways. Here’s how different asset classes may respond:
1. Stocks
The impact of inflation on stocks can vary. Some companies may be able to pass higher costs onto consumers, preserving profits, while others may see squeezed margins if they can’t.
Historically, moderate inflation hasn’t significantly hurt equity performance over long periods. But in high or rapidly rising inflation environments, market volatility may increase.
2. Bonds
Fixed-income investments like bonds may be sensitive to inflation. When inflation rises, bond prices often fall, especially for long-term bonds, because their fixed payments become less valuable in real terms.
However, certain types of bonds, like Treasury Inflation-Protected Securities (TIPS), are designed to adjust with inflation.
3. Cash and savings
If inflation is higher than the interest you’re earning on your savings or short-term instruments, your purchasing power erodes over time.
Example: If inflation is at 4% and your savings earn 1%, your money’s purchasing power is effectively shrinking by 3% annually.
Conclusion
Inflation may not always be easy to spot, but over time, it can quietly reduce the value of your money. It’s a natural part of how economies grow and shift, and tools like monetary policy and diversified markets exist to help manage its effects.
You don’t need to view inflation as something to fear—but being aware of how it works can help you better understand how it might influence your purchasing power and long-term financial goals.
Staying informed is key. On Public.com, as a member you’ll gain access to a powerful suite of tools and data, including our Income Hub, which lets you track monthly earnings from all your interest and dividend-paying assets and forecast your income for the year ahead.
Join Public today and start building your multi-asset portfolio with the tools, data, and insights you need to make informed investment decisions.