When evaluating a company’s financial health, one of the first questions investors often ask is: How much debt is too much? That’s where the debt-to-equity (D/E) ratio comes into play. This simple yet powerful metric may help you understand whether a company is funding its operations through debt or equity—and what that means for its financial stability.
In this guide, we’ll break down what the D/E ratio is, how to calculate it, and how investors can interpret it to assess a company’s financial health.
Debt-to-equity ratio shows financial health: It compares a company’s total debt to shareholder equity.
It may offer a window into how a company funds its operations and financial risk profile.
There’s no one-size-fits-all “good” or “bad” ratio—industry norms, business models, and financial strategies all matter.
The calculation formula: D/E Ratio = Total liabilities / Shareholders’ equity
What is the debt-to-equity ratio?
The debt-to-equity ratio is a financial metric that compares a company’s total liabilities to its shareholder equity. It’s calculated by dividing the company’s total liabilities by its total shareholder equity:
The formula for calculating debt-to-equity ratio:
Debt-to-equity ratio = Total liabilities / Shareholders’ equity
Let’s break this down:
Total liabilities include all of a company’s financial obligations—this may range from long-term loans to accounts payable.
Shareholders’ equity represents the owners’ share of the company, which includes retained earnings and the capital invested by shareholders.
Why does the debt-to-equity ratio matter?
The debt-to-equity ratio may offer a snapshot of a company’s financial leverage. A high ratio could suggest that a company is financing a significant portion of its operations through debt. A lower ratio might imply that the company is using more equity to support its activities.
This ratio can help you gauge how risky a company might be when it comes to taking on additional debt. However, context is crucial—what may be considered “high” for one industry could be normal in another.
Example: Comparing two companies
Let’s say you’re comparing two U.S.-based firms:
Company ABC
Total liabilities: $5 million
Shareholders’ equity: $10 million
Debt-to-equity ratio = 0.5
Company XYZ
Total liabilities: $15 million
Shareholders’ equity: $5 million
Debt-to-equity ratio = 3.0
Company ABC has a D/E ratio of 0.5, which may suggest it’s less reliant on borrowed funds. Company XYZ, with a D/E ratio of 3.0, may be using more debt to finance its growth or operations.
But this number alone doesn’t tell the whole story. For example, some capital-intensive sectors like utilities or telecom may naturally operate with higher D/E ratios.
Debt-to-equity ratio: What different levels may suggest
When you look at a company’s debt-to-equity (D/E) ratio, it helps to think of it as a signal of how the business balances what it borrows versus what it owns. Here’s how different levels of this ratio may be interpreted, depending on the context:
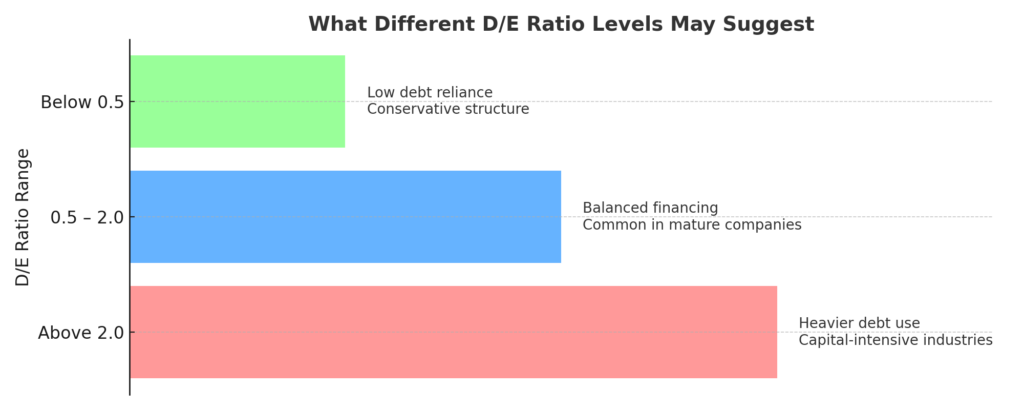
1. Higher D/E ratio (Above 2.0)
A D/E ratio above 2.0 may indicate that the company relies more heavily on debt financing. This kind of financial structure is often seen in capital-intensive industries—such as utilities or telecom—where borrowing is commonly used to fund infrastructure and long-term projects. While this level of debt can support expansion, it may also introduce more financial obligations.
2. Moderate D/E ratio (Between 0.5 and 2.0)
This range often reflects a balanced approach to financing, where a company may be using both equity and debt to support its operations. For some well-established firms, a ratio in this range may indicate flexibility in funding strategies while still maintaining manageable debt levels.
3. Lower D/E ratio (Below 0.5)
A lower D/E ratio suggests the company may be leaning more on equity than debt. This could be a sign of a conservative financial strategy, with limited borrowing. While this may help reduce financial risk, it might also mean fewer opportunities to leverage borrowing for growth—especially when interest rates are low.
Interpreting the debt-to-equity ratio in different industries
The D/E ratio varies significantly across different industries due to differences in capital requirements and business models. Here are some examples of average D/E ratios across various industries:
Industry
Average D/E Ratio
Tech
0.1 – 0.5
Utilities
1.0 – 2.0
Consumer Goods
0.4 – 1.0
Financial Services
1.0 – 3.0
Real Estate
0.5 – 2.5
In capital-heavy industries like utilities, higher D/E ratios are common due to the large infrastructure investments required. Meanwhile, software or tech companies might operate with very little debt.
Note: Industry context matters. A D/E ratio that seems high in one sector may be the norm in another.
How D/E ratio may help investors
The D/E ratio tells investors how a company manages its funds. It helps answer questions like:
Does the company take on a lot of debt? If yes, it may have higher costs from interest payments.
Does the company mainly use its own money? If yes, it may be more stable but might grow slowly.
Is the company balancing debt and shareholder money wisely? A balanced ratio may mean the company is handling its finances well.
Stock investors: A high D/E ratio can signal financial risk, especially if earnings fluctuate, as too much debt can hurt profits. However, some companies successfully use debt to fuel growth, which may lead to higher stock returns.
Bond investors: Lenders prefer companies with a lower D/E ratio, as excessive debt increases the risk of default. If a company is highly leveraged, bondholders may demand higher interest rates to compensate for the increased risk.
Dividend investors: If a company has too much debt, it may have to cut dividends to service interest payments. Investors who rely on dividend income should be cautious of companies with a high D/E ratio.
Each industry has different norms, and investors should compare companies within the same sector rather than applying a single standard across all industries.
What a high debt-to-equity ratio may mean
A higher D/E ratio may signal that a company is taking on more debt relative to its equity. This could raise some potential concerns:
Debt repayment risk: If business slows down or interest rates rise, servicing that debt might become challenging.
Interest expense impact: Higher debt usually comes with more interest payments, which may reduce earnings.
Vulnerability in downturns: Companies with more debt may be more exposed to economic volatility.
However, some firms strategically use debt to fuel expansion, pursue acquisitions, or fund operations more efficiently.
What a low debt-to-equity ratio may indicate
On the other end, a lower ratio may suggest a company is more conservative in its financial approach:
Greater financial flexibility: Less debt may provide room to borrow if necessary in the future.
Lower financial risk: These companies might be in a better position to weather downturns or unexpected costs.
Potentially slower growth: Without debt as a tool, expansion might depend more on cash reserves or equity financing.
Again, context matters. A low D/E ratio doesn’t necessarily mean a company is better—it depends on the company’s strategy and sector.
Limitations of the D/E ratio
While it’s a useful tool, the D/E ratio has its limits:
Book value vs. Market value: The ratio uses book value for equity, which may differ significantly from market value, especially for fast-growing companies.
Off-Balance sheet liabilities: Not all debts (like operating leases or guarantees) are always clearly stated on the balance sheet.
Industry differences: One industry’s “healthy” ratio may be another’s red flag.
Using the D/E ratio as part of a broader analysis—along with cash flow, profitability, revenue trends, and industry outlook—may provide more meaningful insights.
Conclusion
The debt-to-equity ratio can offer helpful insight into how a company manages its financial structure, especially when used alongside other metrics like earnings, cash flow, and industry trends. While it won’t give you all the answers on its own, it may help you ask better questions when reviewing a company’s balance sheet or financial reports.
If you’re just starting out or prefer learning with data in hand, the Public app makes it simpler to explore these kinds of metrics in real time. You can view 5-year debt/equity ratios, P/E ratios, earnings reports directly in our app.
Signup on the Public app to start reviewing company fundamentals and build a multi-asset portfolio that includes everything from stocks and options to bonds, crypto, and a High-Yield Cash Account.